These interactive lesson plans and activities are open to everyone, with a focus on students, formal educators, and informal educators to increase ocean and environmental literacy. These activities will help students gain a better understanding of global increases in average temperature, the impacts of these increases, and more.
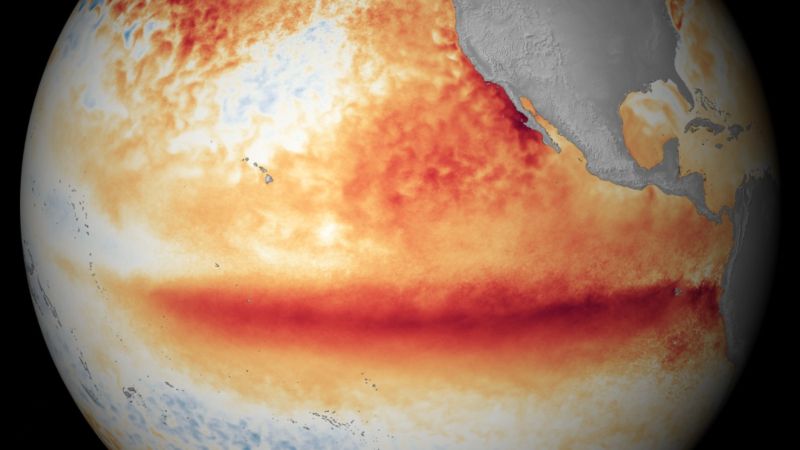
Investigating El Niño & Impacts of Changing Ocean Temperatures
Students explore ocean temperature data visually with NOAA View Global Data Explorer. They consider impacts of changing ocean conditions on marine sanctuaries and wildlife, as well as global impacts of El Niño and La Niña and other changes that impact the ocean and Earth’s climatic and living systems that depend on it.
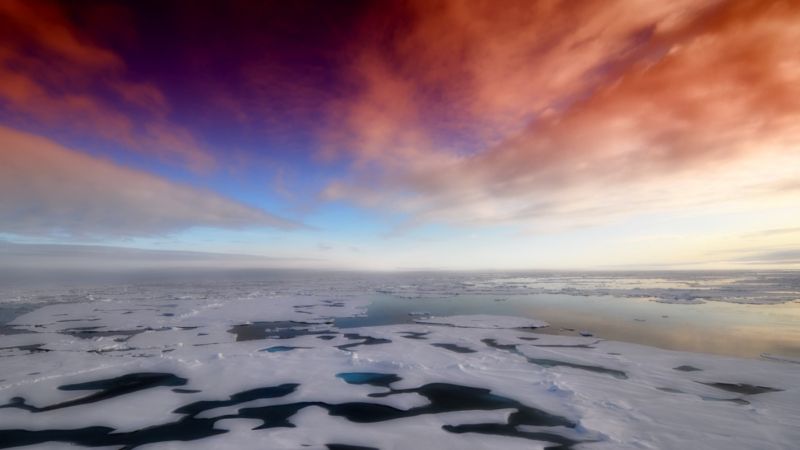
Investigating Albedo & Ocean Feedback Loops
Students investigate the temperature effects of shining light on differently colored materials. They design experiments to test the important role albedo plays in determining how much radiation is absorbed by a substance.

Help Nemo Find His Home!
This lesson focuses on understanding the impacts of ocean acidification on the olfactory senses of clownfish. Students will be able to define ocean acidification and understand how specific species such as the clownfish may be affected by the increasing acidity of the ocean.

Marine Osteoporosis
In this lesson students will explore the effects of an acidic ocean on certain marine organisms, in the ocean food web, and to humans. Students will conduct a science experiment using the scientific method to see the effects of increased acidity on certain species. They will also investigate the causes for increased ocean acidity and discuss ways to minimize the impact as an individual and as a society.

Whale Jenga: A Food Web Game
Students will use the game Jenga to learn about the marine food web and how small changes in the food web can have large effects on other organisms.

Resilience in Your Community Activity Book
Through this activity book, we hope students learn more about your community and how they can make a difference to increase community resilience to environmental change and extreme weather events. Making communities more resilient requires all of us working together. As first steps, it is important to learn what resilience means and then explore your own community and its resources and potential areas for improvement.

Resilience in Your Island Community eBook
Through an interactive eBook, you will learn about community resilience, indigenous knowledge in Hawai‘i, and ways to make a difference in your island community. As you complete the activities, keep track of your points and earn a resilience patch for your efforts!

Changing Seasons
In many parts of the United States, you might change your wardrobe with the seasons, grabbing a heavy coat in winter, while wearing only a light T-shirt in summer. Although ecosystems, plants, and animals cannot adjust their attire quite so easily, they have evolved to make changes that help them survive seasonal conditions caused by the rotation of the Earth around the sun.

The Incredible Carbon Journey
This activity is a way to compare the carbon cycle before the industrial revolution with the carbon cycle currently. This is a great way to communicate important ideas about the carbon cycle.

Teaching Heat
The education community can use the following heat-related education resources for a variety of audiences, in and outside of the classroom.