SanctSound Sonar Study Details

To determine the overlap in time and space between humpback whale signals (song) and Navy signals, SanctSound researchers recorded sound at five locations in sanctuary waters, and three in monument waters for the 2018 through 2021 humpback whale seasons
This was a lot of listening, amounting to roughly sixteen terabytes of data (for reference, about 500 hours of high definition movies fit in 1 terabyte). To find humpback song in all that data, NOAA collaborated with Google on a new technique to identify humpback song occurrences in the recordings, and relate their collective chorusing to the number of whales seen at the surface in the same areas.
When it came to detecting sonar, however, the humpbacks were now the noise and not the signal. Navy researchers collaborated with Cornell University to further develop a tool to automatically screen data to identify sonar signals—a difficult task with so many singing humpbacks. The tool they used needed to be further refined, or “trained”, to discriminate between the two.
NOAA provided the Navy team with training datasets, painstakingly listening to recordings from one set of deployments and using the human eye and ear to find sonar against the humpback singing background. Five sites in sanctuary waters (December-June) and three sites in monument waters (October-June) for one full deployment were provided to the Navy. Sonar events were detected by NOAA at four of the eight recording sites: on the north shore of Kauai, east Oahu, and Olowalu off west Maui in sanctuary waters, and at Middle Bank in monument waters. The training datasets helped the Navy team to improve the performance of the automated sonar detector in Hawaiian waters. The Navy team focused on two data sets: the site where NOAA found the most sonar present (Kauai) and a site where NOAA did not find any sonar present (Penguin Bank). The detector found sonar activity 0.4% of the time off Kauai and 0% of the time off Penguin Bank, which matched really well with what NOAA found. With more confidence in its output, the Navy team is now screening all of the SanctSound recordings from three years of data collection from the region.
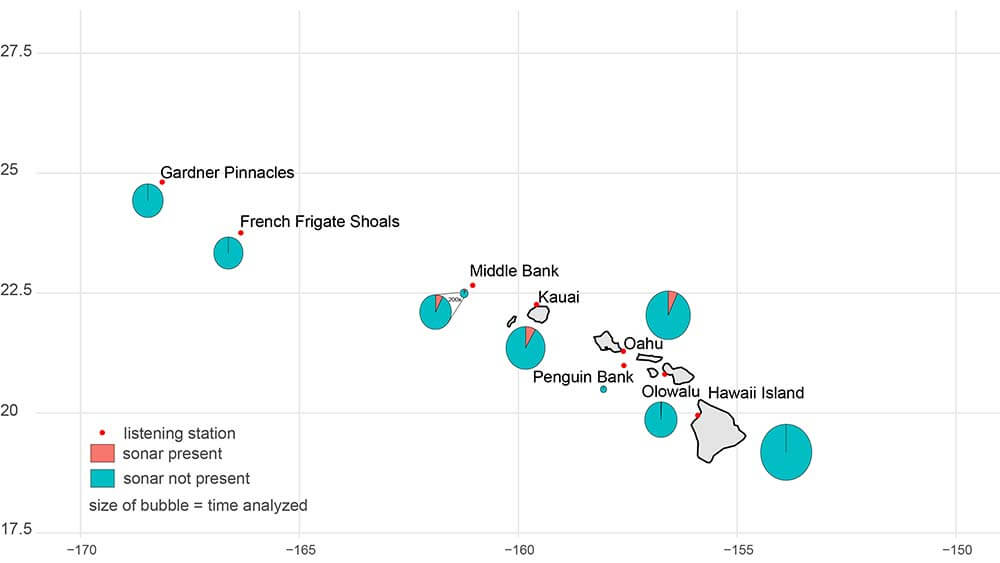
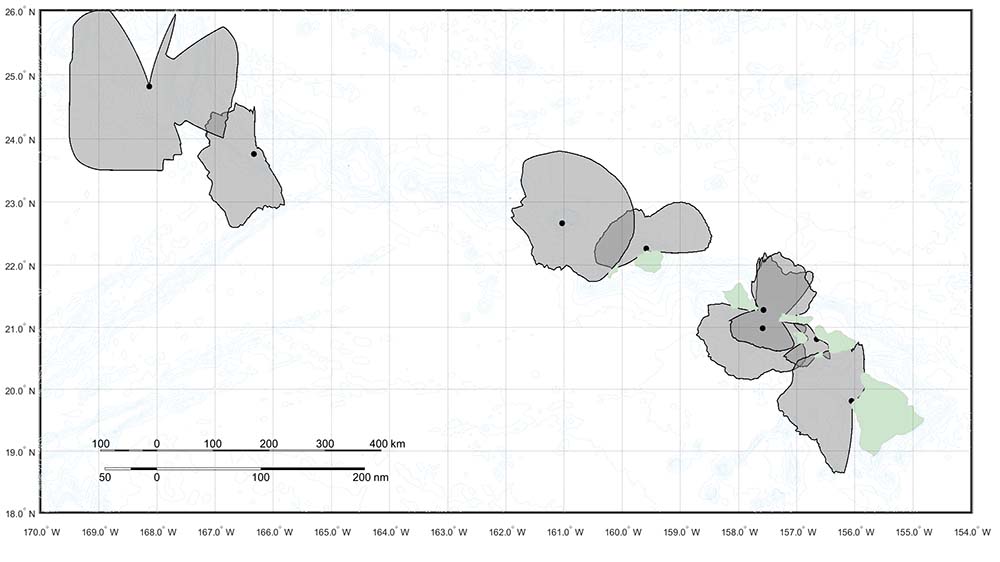
Do these initial results mean that there are no sonars in monument or sanctuary waters other than at the four sites where sonar was detected? Where sonar was detected, do these results mean that sonars are being used in or very near sanctuary waters in these areas? To answer these questions, we have to consider the different distances over which each recorder was able to listen to sonar. Termed “listening ranges”, these distances are predicted to vary, with locations exposed to longer-distance sound transmission in deeper waters, such as Gardner Pinnacles and Middle Bank in Papahānaumokuākea Marine National Monument, able to hear sonars over very large ranges, while sites between Oahu and Maui in Hawaiian Islands Humpback Whale National Marine Sanctuary, which were shallower or shadowed by other islands, listened over more local and overlapping ranges.
The Navy team is looking forward to using the new automated sonar detector on the rest of the data collected, so they can continue working with NOAA to identify patterns of overlap in acoustic use over these listening ranges.